Last updated
How to Compare Trade Show Results Across Events: Cost per Lead, ROI and One Table
By KatchT Team
Calculating one event's ROI is a solved problem for most teams. Add up the costs, count the leads, do the math. The number that actually changes next year's budget is harder to get to: which of the twelve events you ran outperformed the others, and by how much.
Every event gets judged alone
Without a shared view across events, each show is evaluated in its own report, in whatever format whoever built it that quarter chose. There is no consistent way to line them up and ask "which of these should we do again."
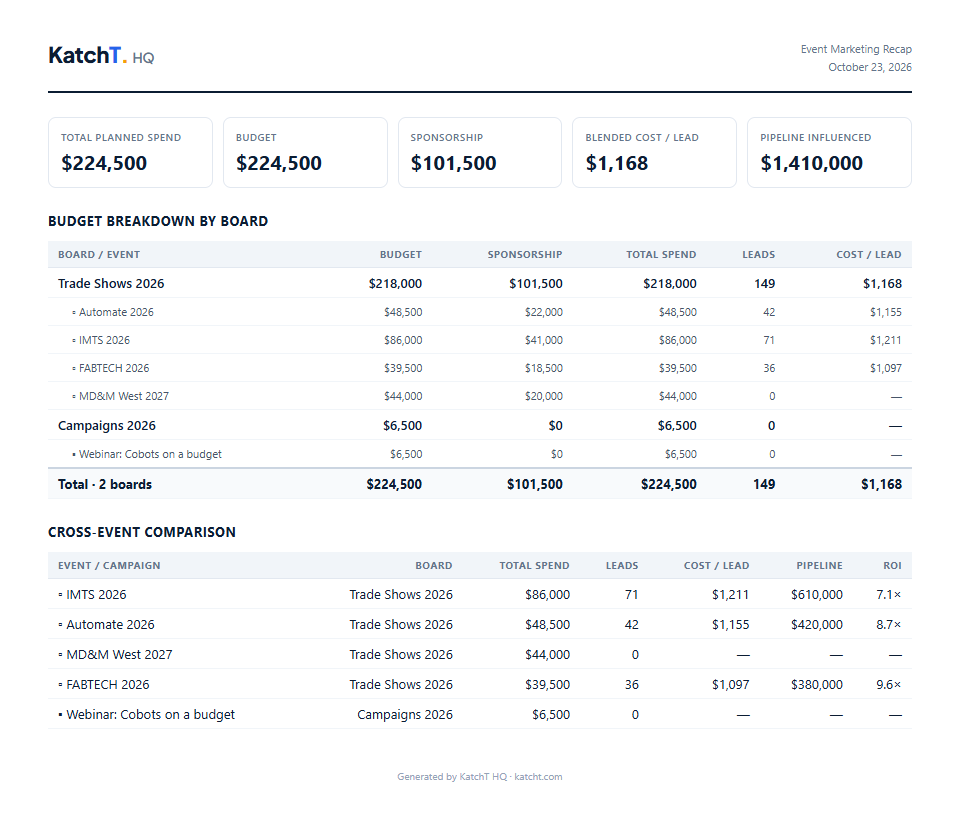
Maybe your regional field events beat the flagship national show on cost per lead. Maybe webinars beat both on cost and lose on close rate. Without the events in one table, that pattern stays buried across a dozen spreadsheets and slide decks.
The seven columns
One row per event, the same seven columns for every row:
- Event and the dates.
- Format. Trade show, field event, webinar, sponsorship. This is the column that makes patterns visible.
- Total cost. Actuals, not the budget: booth, travel, staff time, shipping, sponsorship fees.
- Qualified leads. Conversations, not badge scans.
- Cost per lead. Total cost divided by qualified leads.
- Revenue. Closed revenue inside a fixed window, or pipeline if that is all you have. Label which one.
- ROI. Revenue minus cost, divided by cost.
Normalize before you compare
The table lies if the rows were built differently. Before you compare, hold four things constant:
- Same cost lines. If staff time counts for one show, it counts for all of them.
- Same lead definition. A qualified conversation at the booth is a lead. A badge scan is a scan.
- Same close window. Ninety days after the event is a common choice. Pipeline at 90 days for the recent shows, closed revenue for the older ones, and say which is which.
- One currency and one deal-size source. First-year contract value from the CRM, or the same average for every row.
Read the table
Take three events from one year, with a $30,000 average deal and close rates from the CRM:
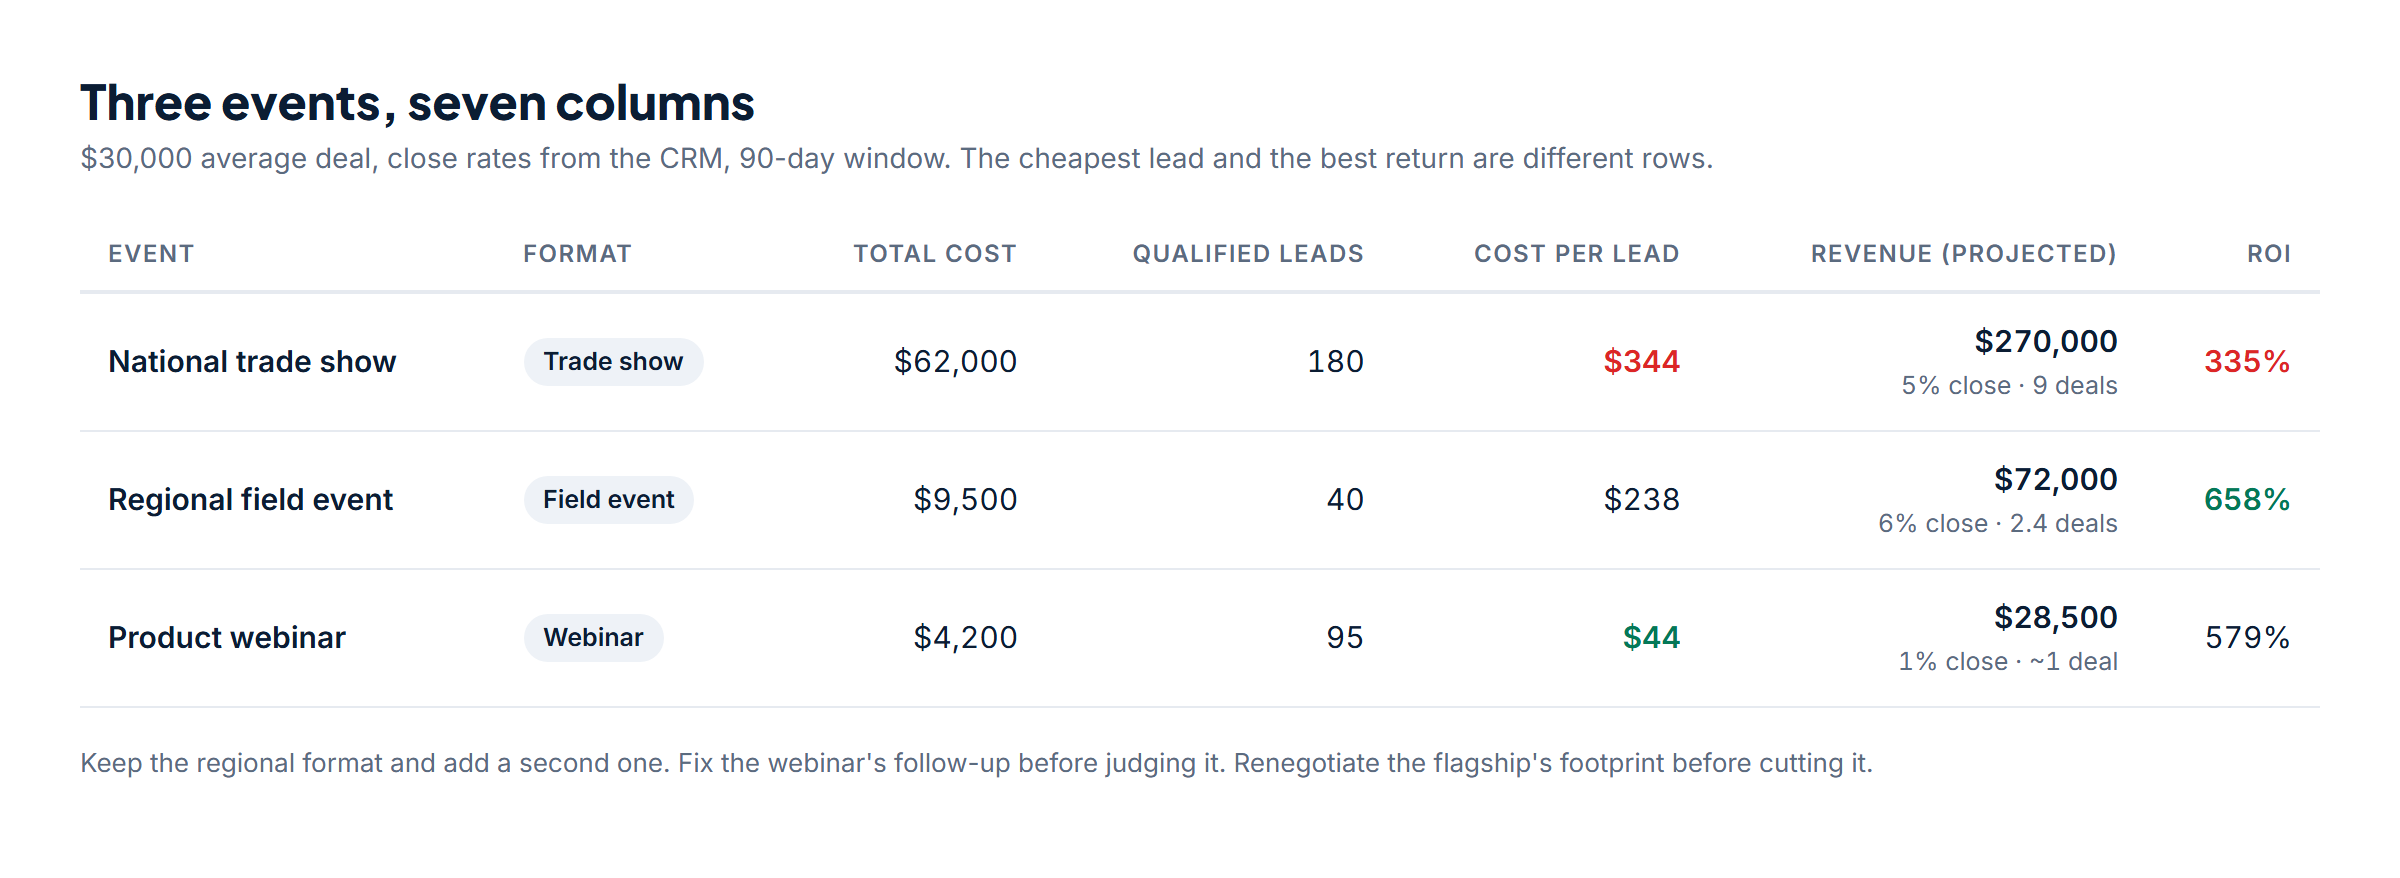
- National trade show. $62,000, 180 qualified leads, $344 per lead. At a 5% close rate, 9 deals and $270,000. ROI 335%.
- Regional field event. $9,500, 40 leads, $238 per lead. At 6%, 2.4 deals and $72,000. ROI 658%.
- Webinar. $4,200, 95 leads, $44 per lead. At 1%, roughly one deal and $28,500. ROI 579%.
The webinar has the cheapest lead by a mile and the fewest deals. The regional event has the best return. The flagship show produces the most revenue and the weakest ratio. Each is a defensible decision, but only when the three rows sit together: keep the regional format and add a second one, fix the webinar's follow-up before judging it, and renegotiate the flagship's footprint before cutting it.
Budget gets allocated on memory, not data
When nobody can pull up "here's how every event performed," next year's budget defaults to "what we did last year," not to what the numbers say should get more investment. The table above is the difference between an opinion in the budget meeting and a finding.
Do it now
In a spreadsheet: one tab, one row per event, the seven columns, and a notes column for the close window you used. Sort by cost per lead, then by ROI, and look at the format column for the pattern.
In KatchT HQ: Reports ranks every event and campaign side by side from the budgets and leads your team already enters, with cost per lead and ROI per row (cross-event comparison is on the Pro plan). The same table prints inside the event recap PDF, and the AI assistant can answer "which show had the lowest cost per lead this year" from the same data. See how Reports works.